Trade Review
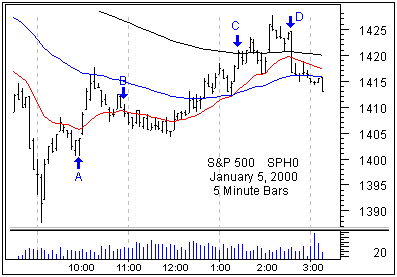
Price opened today in very volatile, noisy conditions and moved up into
the active 5-Min zone. We considered shorting here but with a consolidation
day on our agenda, we unfortunately passed on this early short. Price
moved about 28.00 points lower from our entry point. The move down was
quite fast and did not give us a reasonable entry point.
Price moved down and made a spike bottom as the TICK almost duplicated
the low TICK value of yesterday, setting up a TICK-price climax. We wanted
to get long at this point but again had no entry point. Price made three
pushes up and then made three small pushes down and we entered. We were
rewarded almost immediately with a fast, 18.00 point move up. All of our
contracts were exited with positive slippage.
Our entry on this trade, aside from what was previously mentioned, came
from noticing strength in the Dow and what looked like weakness in the
Nasdaq. The Nasdaq, however, started moving higher and this was our trigger
for entry. We exited our third contract because the Dow was approaching
its down trendline and its 30-Min active zone. We also had a completion
structure on our 3-Min charts, indicating the move was close to retracing
along with negative divergences on our oscillators.
We shorted the market when our indicators suggested the third push up
was about to move lower. This is a successful trade but the move down
was truncated and without momentum. This should have been our clue to
look for a long entry.
Price moved sideways for about an hour and then moved quickly higher
at the 12:00 Cycle Timing. We and our entry system kept expecting price
to reverse as it worked its way higher. We shorted when price reached
the 1420.00 level where there was resistance and the active 60- Min moving
average zone. Price hesitated here but moved higher, stopping us out.
We spent the balance of the day looking for a short entry because we
had a high expectancy that price would close within 3.00 points of the
1409.00 open based on pattern matching. (Price closed within 4.00 points
of the opening).
Price action was very noisy at the top and the only clue we had of the
reversal was when it was occurring, creating 3.00 points of slippage per
contract on entry. The trade though was a winner. We exited our last contract
at a bad point on a reversal indication. The reversal did not occur and
price moved noisily lower into the close.
Outlook
Price bounced off of the weekly moving average today at the 1389.70
level. Not only do we have the weekly moving average at this level but
the cycle top of an eight-month long consolidation zone. Moving below
this level will be difficult.
Our short-term directional oscillator flipped up today and usually signals
a higher close. The momentum of this move down can negate this indication,
however, The internal indicators are now heading into the oversold zone
with VIX and TRIN signaling higher prices for tomorrow. In trending markets,
however, these indicators can stay overextended for long periods, so there
is no help there.
Our best indication comes from pattern matching. We have a 67% probability
of continuation down tomorrow. In all cases but one the opening gap was
less than 1.50 points with the one exception being a 17.00 gap higher
on August 31, 1998. Additionally, the open to high relationship of those
67% of cases that move lower was, for the most part, less than 1.50 points
with three instances of price moving up from the open to the high of between
6.80 and 7.00 points.
Bottom line: once price moves in excess of seven points, especially to
the downside, we should enter. We will stand aside early unless we see
an early low risk setup.
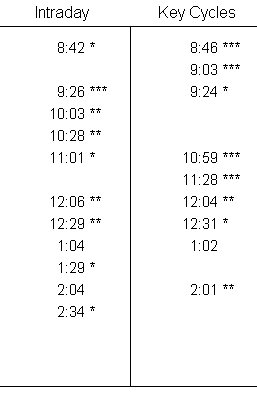
Cycle Timing for tomorrow is 8:42–8:46, 9:03, 9:24–9:26, 10:03, 10:28,
10:59– 11:01, 11:28, 12:04–12:06, 12:29–12:31, 1:02–1:04, 1:29, 2:01–2:04
and 2:34.
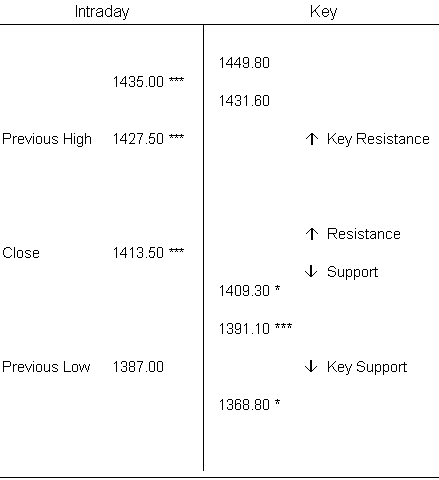
Support/Resistance for tomorrow is 1368.80, 1391.10, 1409.30, 1413.50,
1427.50 and 1435.00.
Good trading,
Charles Holt, CTA
Publisher - Daytrader’s Bulletin
|


 There
is a risk of loss in futures trading.